How to Backtest on Bookmap: Leveraging Order Flow and Market Depth for Deeper Insights
Published on 3/23/2026In a trading landscape increasingly dominated by algorithmic execution, understanding market microstructure beyond simple price charts has become paramount. While many backtesting platforms offer historical price data, a staggering 60-73% of US equity trading volume is now algorithmic, highlighting the need for tools that reveal the underlying forces of supply and demand – order flow and market depth. This deep-dive explores how Bookmap, a specialized visualization tool, allows traders to backtest strategies using this granular data, offering a level of insight traditional methods simply cannot provide.
Key Takeaways
- Traditional backtesting platforms often miss crucial market dynamics by only replaying price movements, whereas Bookmap's replay mode includes order flow, live market depth (DOM), and liquidity heatmaps.
- To initiate backtesting in Bookmap, traders must first ensure the "Record Historical Data" checkbox is ticked in startup settings to save tick-by-tick order book information.
- Bookmap’s distinctive visualization converts traditional tabular DOM data into a real-time heatmap, vividly illustrating the concentration and distribution of bids and asks.
- Advanced order flow tools, such as the MBO Bundle and Tradermap Pro, available with Global or Global+ Bookmap packages, provide granular insight into individual order behavior and liquidity dynamics.
- The "Replay Mode" in Bookmap is an "amazing function" that allows users to revisit any recorded session, playing back everything second to second for in-depth analysis and strategy refinement.
The Unique Advantage of Bookmap's Order Flow Data in Backtesting
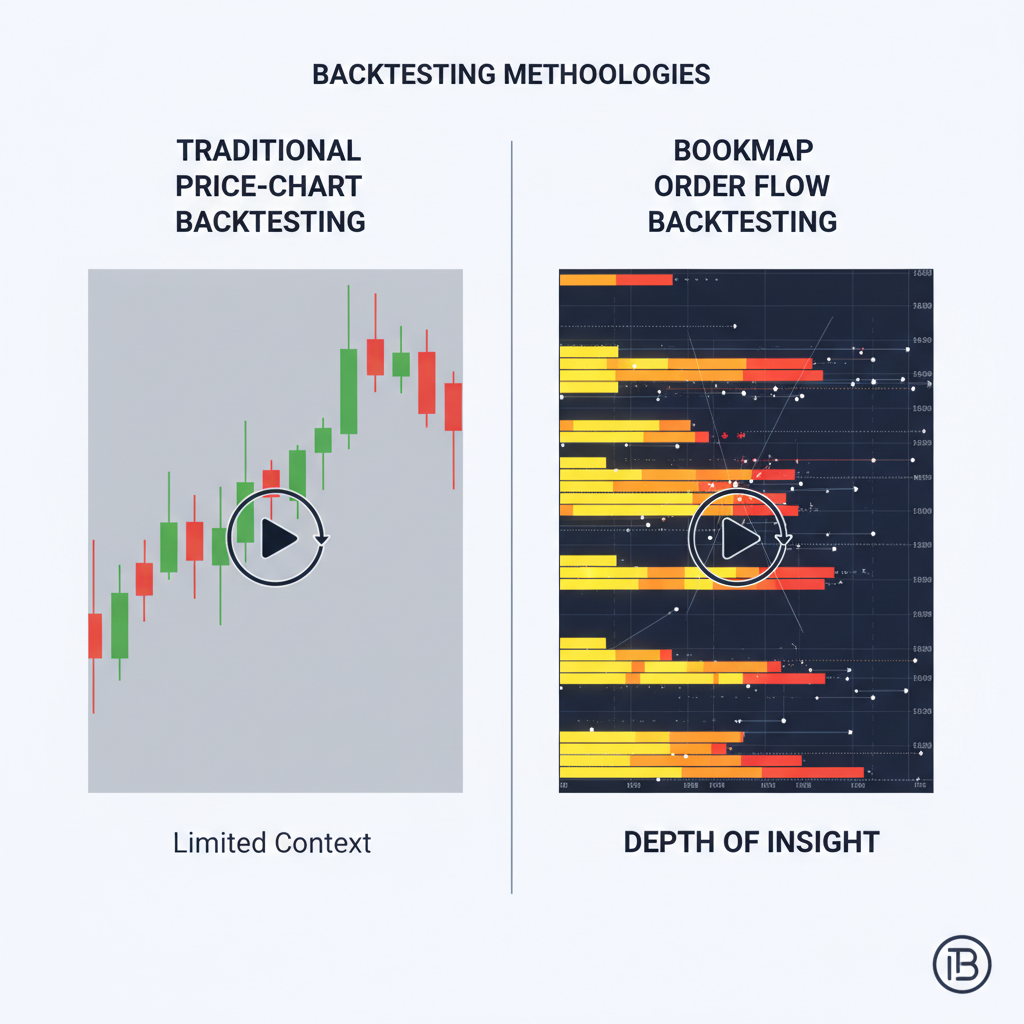
Conventional backtesting typically relies on aggregated historical data like candlestick charts, volume bars, and fundamental indicators. While these provide valuable macro insights, they often obscure the precise supply and demand mechanics at play. Most platforms only let you replay price movements, which can lead to incomplete conclusions about strategy effectiveness. This limitation is particularly critical given that liquidity dynamics and order book imbalances are key drivers of short-term price action, often accounting for rapid market shifts that defy purely technical analysis.
Bookmap addresses this fundamental gap by offering a granular view into the market's hidden activity. Its replay mode extends beyond mere price action, encompassing the live market depth (DOM), order flow, and intuitive liquidity heatmaps. This comprehensive data set allows traders to analyze not just where price went, but critically, to understand why it moved. For instance, observing large resting orders (liquidity) being absorbed or rejected at specific price levels can validate or invalidate a potential trade setup. Such insights are unattainable with traditional price-based backtesting, leading to a deeper, more robust understanding of market mechanics.
Bookmap’s replay mode doesn't just show you where price went—it helps you understand why it moved, giving you a much deeper look at market mechanics.
By integrating this rich dataset, Bookmap provides an analytical advantage that aligns with the complex, high-frequency nature of modern markets. This depth of analysis is essential for traders aiming to develop strategies sensitive to subtle shifts in supply and demand, offering a competitive edge in volatile environments where every tick can matter. The ability to re-examine historical order book dynamics allows for the identification of recurring patterns related to institutional participation or algorithmic behavior that might otherwise remain invisible.
Step-by-Step Guide to Recording and Replaying Data in Bookmap
Effective backtesting on Bookmap hinges on the proper acquisition and utilization of historical Depth-of-Market (DOM) data. The platform’s replay mode is a powerful feature, but it requires users to proactively capture the necessary information. The initial step involves ensuring that Bookmap is configured to save historical market data, a critical prerequisite for any meaningful analysis of past order flow.
To record data, traders must make sure the "Record Historical Data" checkbox is ticked in the startup settings when launching the platform. This seemingly simple toggle is crucial; if left off, no data will be saved for future replay. Users can run Bookmap with this setting enabled for varying durations—whether a few sessions, an entire trading day, or during specific high-impact news events—to collect the desired historical context. The flexibility to select specific periods allows for targeted analysis, enabling traders to focus on market conditions relevant to their strategy's applicability, such as high volatility, low volatility, or specific intraday cycles.
Once sufficient data has been recorded and saved locally, the next phase involves entering Bookmap's dedicated replay environment. This is achieved by closing Bookmap completely and then reopening it. In the "Run Options" window that appears upon startup, instead of connecting to a live exchange or broker, users must select "Replay Data." This action transforms Bookmap from a real-time visualization tool into a historical analysis engine. The replay mode allows traders to navigate through recorded sessions second to second, observing every change in the order book, executed trades, and liquidity heatmaps as if it were happening live. This immersive experience is invaluable for refining trading techniques, identifying decision points, and understanding the immediate impact of order flow on price behavior, essentially allowing for a "rewatch" of market dynamics with all the players' communications revealed.
Integrating Depth-of-Market (DOM) and Liquidity Heatmaps for Nuanced Strategy Refinement
Bookmap fundamentally transforms how traders perceive Depth-of-Market (DOM) data. Instead of the traditional tabular display of bids and asks, Bookmap provides a real-time heatmap, offering a dynamic and highly visual representation of market liquidity and volume. This visualization is not merely aesthetic; it distinctly illustrates the concentration and distribution of bids and asks within the market, revealing areas of potential support and resistance with unprecedented clarity. For instance, observing a "thick" band of liquidity forming on the heatmap can indicate a strong price level where institutional orders are accumulating, providing a visual cue that a tabular DOM might obfuscate.
Integrating this visual DOM data into backtesting scenarios provides a more comprehensive view of market dynamics than traditional methods. Traders can analyze historical fluctuations in liquidity levels over time, observing how demand and supply shift in response to price movements or external events. This enables the identification of patterns and trends in market depth that might signal impending breakouts, reversals, or exhaustion points. For example, a sudden disappearance of liquidity at a key level followed by aggressive buying can be a powerful signal of an impending upward move, whereas a static, large block of orders that remains untouched might suggest strong support or resistance that needs significant volume to overcome. The ability to utilize Bookmap’s zoom-out feature further enhances this, allowing traders to extend their view beyond immediate market activity and capture a broader historical context for in-depth analysis, ensuring patterns identified are robust across different timeframes.
Furthermore, Bookmap's visualization of market volume assists in analyzing historical trading volumes. Traders can assess volume patterns and correlations with price movements, aiding significantly in strategy development and risk management. For example, a price push accompanied by low volume on the heatmap might indicate a weak move susceptible to reversal, while high volume could confirm the strength of a trend. The platform’s advanced capabilities allow for a deeper understanding of market behavior, offering a unique perspective and a more nuanced understanding of how liquidity and execution interact to shape price. This granular insight, especially when combined with other technical analysis tools, significantly enhances the ability to make well-informed trading decisions and refine strategies with greater precision.
Beyond Price: Advanced Order Flow Tools for Strategy Validation
Order flow strategies demand a high degree of precision, requiring insights into the subtle nuances of market behavior that go beyond simple price and volume. Bookmap offers a suite of advanced tools specifically designed to provide this deeper understanding. These tools give traders critical insights into how liquidity behaves, distinguishing between aggressive and passive orders, and determining whether the market is absorbing or rejecting price at key levels. This layered approach is essential for backtesting order flow signals and refining consistency over time.
For traders operating with the Global or Global+ Bookmap packages, access to specialized indicators like the MBO Bundle, Tradermap Pro, and Liquidity Tracker Pro becomes available. The MBO Bundle, for instance, allows users to see every buy and sell order—including its size and price—on an individual level. This feature is instrumental in confirming whether observed volume is real or misleading and allows for tracking specific order types like stops or iceberg orders with unmatched clarity. Building custom heatmap views by applying MBO filters to instrument copies enables traders to compare different order book layers or highlight specific behaviors, providing a targeted analysis that would be impossible with aggregated data.
Order flow traders commonly combine these advanced tools to validate signals through multiple dimensions. For example, integrating delta divergence with price action can help confirm market exhaustion, indicating a potential reversal when aggressive buying or selling diminishes despite price continuing in the same direction. Similarly, volume-based tools, which are integral to Bookmap's visualization, allow traders to define value areas before executing trades, ensuring entries and exits are aligned with actual market participation rather than mere price speculation. Order flow strategies rely on full depth-of-market data, which Bookmap visualizes directly through its heatmap and volume tools, offering the real-time context necessary to anticipate market movements rather than just reacting to price.
How Horizon Addresses This
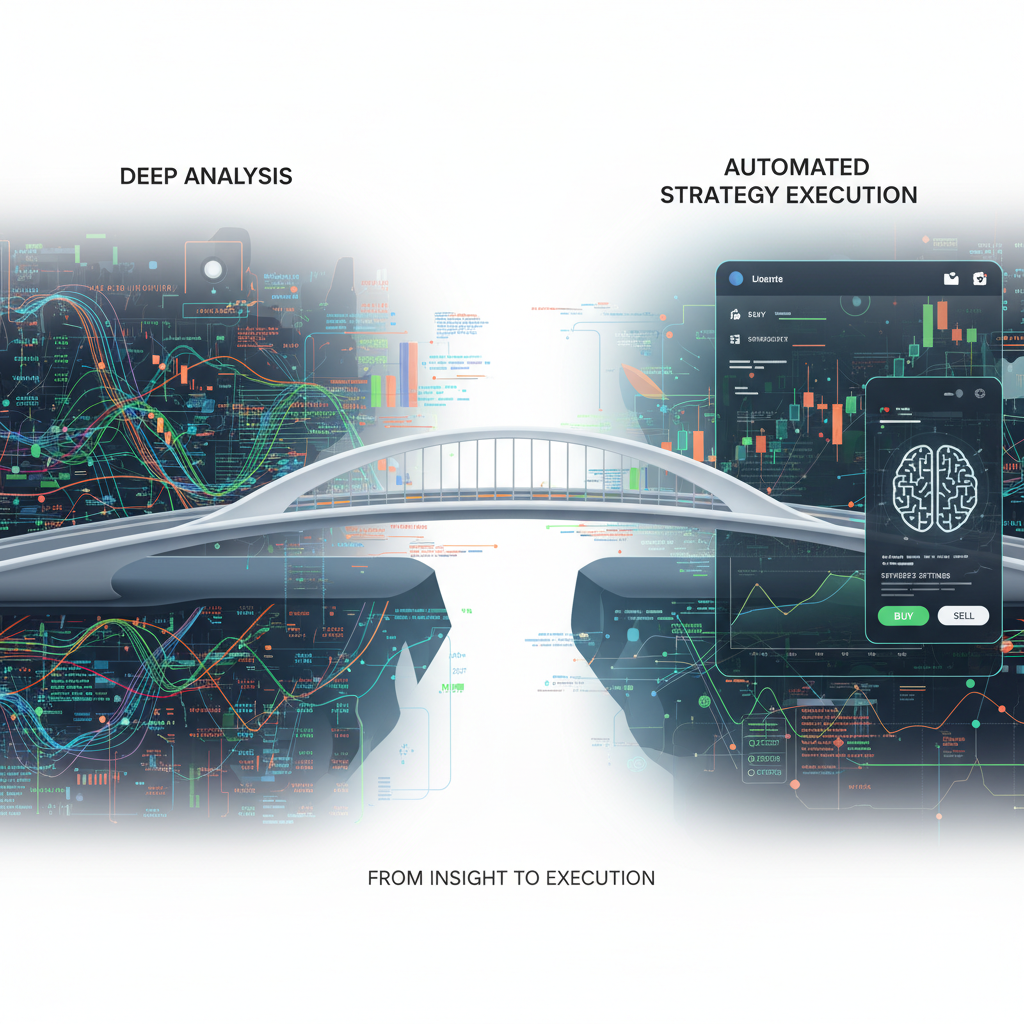
While Bookmap offers unparalleled visual insights into order flow and market depth, its strength lies in manual, discretionary analysis and backtesting. For serious traders who think systematically but may lack coding expertise, transforming these granular insights into automated, disciplined strategies can be a significant hurdle. This is where Horizon Trade steps in, bridging the gap between sophisticated market understanding and automated execution.
Horizon’s AI-powered platform enables traders to generate custom trading strategies without writing a single line of code. Imagine identifying a profitable order flow pattern in Bookmap – instead of painstakingly trying to code an indicator or strategy, Horizon’s AI can help translate your conceptual edge into a fully executable algorithm. Our institutional-grade backtesting engine then allows you to test these AI-generated strategies against historical market data with detailed performance metrics, including out-of-sample backtesting, Monte Carlo simulations, and heatmaps to ascertain robustness. This comprehensive approach ensures that any strategy, whether inspired by order flow analysis or other market phenomena, is rigorously vetted across various market conditions and assets – including stocks, forex, crypto, futures, and options. For traders who appreciate the depth of Bookmap's data but require an automated, systematic approach to deploy and manage strategies across multiple markets, Horizon offers the necessary tools to operate at the next level, transforming your ideas into disciplined, automated execution.
Conclusion
Backtesting with Bookmap's order flow and market depth data represents a significant advancement over traditional methods, offering traders a profound understanding of market dynamics at a granular level. The ability to replay historical sessions, visualize liquidity through heatmaps, and analyze individual order behavior provides unique insights into why prices move, rather than just observing their trajectory. This meticulous approach is invaluable for refining strategies, identifying robust patterns, and gaining a competitive edge in fast-moving markets.
As the complexity of financial markets continues to evolve, combining deep analytical tools like Bookmap with powerful automation platforms becomes increasingly critical. For systematic traders looking to operationalize their insights and scale their strategies across diverse asset classes without the burden of coding, platforms like Horizon Trade offer a crucial pathway. Explore how Horizon can transform your analytical edge into automated, disciplined execution. For further exploration into systematic trading and AI-driven strategy development, visit the Horizon blog.
Sources
- Leveraging Depth-of-Market (DOM) Analysis for Effective Backtesting
- How to Backtest on Bookmap: Complete Step-by-Step Guide for Traders
- How to Trade With Bookmap: a Detailed Step-By-Step Guide
- Backtesting Techniques: Refining Strategies with DOM Data and Performance Metrics
- Order Flow Strategies with Bookmap
- Complete Bookmap Guide 2025 - Heatmap & Orderflow Platform
